The availability of good and reliable data and statistics are essential for measuring progress in reaching development goals and provide essential information about the effectiveness of policies and programmes.
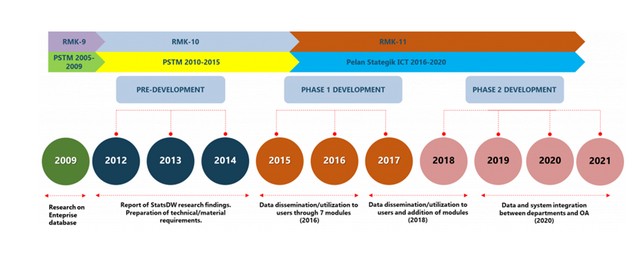
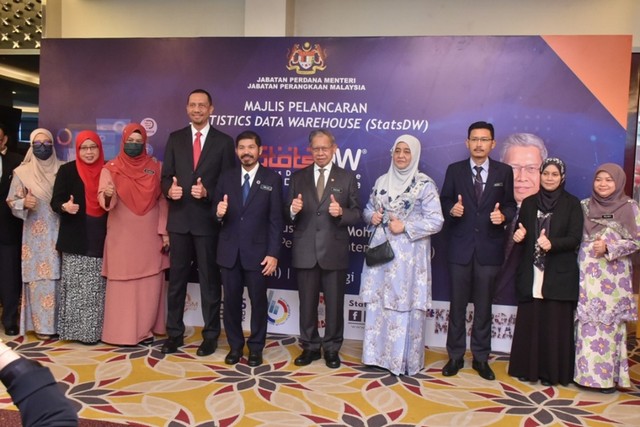
Officially launched in June 2022 by DOSM, the development of StatsDW 2.0 started in 2019 and was completed in 2021.
It combines all data and statistics acquired by the DOSM, either from surveys or censuses, from integration of systems, or from data acquired from other agencies or organizations, into a data warehouse to facilitate the efficient management of data and metadata.

It aims to provide timely, relevant and integrity information to statistical users by enhancing statistical information communication technology so that data collection, data management and data delivery to all users, be it government, private sector, or international organizations, are effectively implemented.
For the government, good and readily available data as well as statistics helps governments improve their policies and to be transparent and accountable about the delivery of development results.
User can obtain data on various sectors and subjects in a more agile and effective system integration within DOSM and other agencies.
For example, user can obtain data on the agriculture sector obtained from the Census. It includes statistics on the agriculture sector which covers crops, livestock, forestry & logging, and fisheries sub-sectors. The data focused on the value of gross output, intermediate inputs, value added, employment, salaries & wages, and the value of fixed assets.
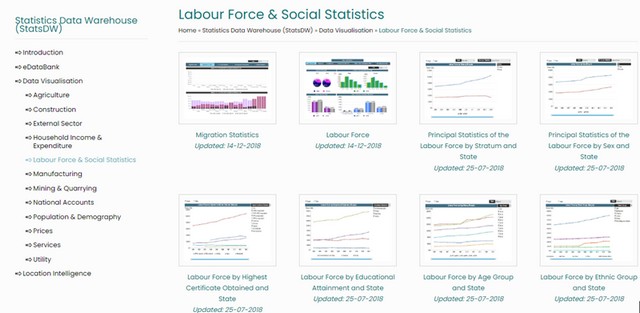
Other data includes those on construction, external sector, household income and expenditure, labour force and social statistics, manufacturing, mining, and quarrying, national account, population and demography and price.
It will provide the statistical user community with timely, near real-time, relevant and of integrity information, as it enhances its statistical information communication technology so that data collection activities, data management and data delivery to all users, are effectively implemented.

Another importance of StatsDW is that it also contains various historical data dimensions.
StatsDW was first developed in October 2014 and was launched in June 2016. It stores historical data from as early as 1974 from various censuses and surveys conducted by the DOSM as well as compiled data for economic indicators.
This can improve the quality of data analysis to provide a more accurate perspective to policymakers, data users and analysts such as global issues facing countries such as food security, rising prices of goods and employment which has a direct impact on the stability of people’s living standards.
This will then be translated into statistics compiled and disseminated by DoSM such as GDP, CPI, external trade statistics and so on.
In addition to this, StatsDW 2.0 can accommodate the overflow of data from various sources where the data as these high value commodities are also available at various agencies. This data overflow requires efficient and integrated data management as well as an effective framework towards holistic statistical production.
Governments, private companies, NGOs, and private individuals alike must decide on important issues on a regular basis; such decisions making require information and frequently needs to be transparent evidenced based in order to be accepted by the wider community.
It is also noted that StatsDW can enrich the skills development skills of DoSM data scientists and the public sector with the use of advanced statistical tools in producing official statistical analysis of the country.

Aside from functioning as a data storage, StatsDW also provides an interactive platform through eDataBank, Data Visualisation and Location Intelligence where users can explore and utilize freely.
- eDataBank -eDataBank is an electronic data bank of DOSM. Users may compile their tables and graphs and export these tables in different file formats. The information can be accessed, downloaded, and printed.
- Data Visualisation – new interactive visualisation techniques were first introduced in 2015, with the Industrial Production Index and the Population Pyramid as the best-known examples. These visualisations give a clearer insight into how important data on a specific area interact.
- Location Intelligence – used for visualizing location-based statistical data through interactive maps, graphs & charts.
StatsDW consists of four modules,
- Smart Data Partnership (SDP) – SDP is designed to provide data providers with a standard and reliable interface to handle the data collection processes in StatsDW settings in a systematic procedure
- Smart Data Lake Management (SDLM) – SDLM is designed to intelligently store all data, including data preparation, alerts, monitoring, and user access, within its respective data lake levels
- Smart Data Communication (SDC) – The SDC is designed to meet a wide range of user needs to consume the available information through multi-channel platforms that are precisely customized to ensure optimal use of the data
- Management Module (MM) – MM is designed for system administrators to monitor and manage users and system. The Management Module will be the command and control of the entire system of StatsDW Phase II
(Source: https://statsdw.dosm.gov.my/)


